stochastic
The background of unresolved compact binaries, Ω_GW(f), predicted from the catalog and compared with the upper limits of the stochastic searches.
gwtc_analysis rates --out-rates merger_rates.tsv
gwtc_analysis stochastic --spectral-posterior hubble_constant_spectral --rates merger_rates.tsv
Inputs
The calculation combines two earlier results: a merger rate today (from rates) and its evolution with redshift and mass distribution (from a hubble_constant run). Run those two modes first. What each input provides, and the other choices: Options.
# the inputs, from the same release: rates and a Power Law + Peak spectral siren (both GWTC-4.0)
gwtc_analysis rates --sensitivity-release gwtc4 --out-rates rates_gwtc4.tsv
gwtc_analysis hubble_constant --workdir h0_plp --stages prepare sample combine reweight \
    --icarogw-python ~/.conda/envs/icarogw/bin/python --seeds 1 2 3 4
# the background, with the fitted rate shape kept beyond the detected events as a check
gwtc_analysis stochastic --spectral-posterior h0_plp --rates rates_gwtc4.tsv --high-z posterior --n-draws 400
Method
The energy density of the background per logarithmic frequency, in units of the critical density ρ_c c² = 3H₀²c²/(8πG), is (Phinney 2001 [83])
with R(z) the merger rate per comoving volume and source-frame time, and ⟨dE/df_s⟩ the energy spectrum of
one merger averaged over the population (Planck15, as the volumes of the rates mode).
| Population | Rate | Masses | Spectrum |
|---|---|---|---|
| BBH | R(0.2) of rates (25.2 Gpc⁻³ yr⁻¹ with its default release, gwtc5), times the Madau–Dickinson shape of each spectral-siren draw |
the mass model of each draw: Power Law + Peak or Multi Peak | inspiral–merger–ringdown, Ajith et al. 2008 [84] |
| BNS | R(0) of rates, star-formation history [16] |
uniform 1–2.5 M☉ | inspiral to the ISCO |
| NSBH | R(0) of rates, star-formation history |
m_BH ∝ m^−2.35 on 2.5–40 M☉, NS uniform 1–2.5 M☉ | inspiral to the ISCO |
The BBH rate is normalized at z = 0.2, where the catalog measures it best. Beyond the farthest detected
events (z_h ≈ 1, from the work directory) the fitted shape is only its prior: by default the rate follows
the star-formation history there, joined continuously at z_h (--high-z sfr); --high-z posterior keeps
the fitted shape up to z = 10.
What the mode does
The mode runs no inference and reads no strain. It reads two products of earlier runs of the package, the
posterior of a hubble_constant spectral siren and the rates TSV of rates, and evaluates the integral above for
draws of them.
- Inputs. The posterior is
posterior_reweighted.tsvof the work directory, elseposterior.tsv, or the TSV given; the mass model is recognized from its columns. From the rates TSV: the 5%, 50% and 95% values of the BNS and NSBH rates and of the BBH rate at its reference redshift (the BBH row withz_ref> 0). - Horizon. \(z_h\) is the redshift (Planck15) of the largest median distance among the events of the run's
inputs.h5, else 1; it must exceed the reference redshift of the BBH rate. - BBH, per draw.
--n-drawsrows of the posterior (fixed seed). For each: 1500 binaries drawn from its mass model (\(m_1\) by inverting the cumulative distribution on a grid, \(m_2 \mid m_1 \propto m_2^\beta S(m_2)\)), their mean Ajith et al. spectrum on 600 frequencies from 1 Hz to 30 kHz (zero above); a rate at the reference redshift drawn from a log-normal matching the median and 90% interval ofrates, times \(\psi(z)/\psi(z_\text{ref})\) with the draw's γ, κ, z_p. With--high-z sfrthe shape beyond \(z_h\) is that of Madau & Dickinson 2014 (γ = 2.7, κ = 2.9, z_p = 1.9), scaled to be continuous at \(z_h\). - BNS and NSBH. One mean inspiral spectrum from 20 000 binaries each, the integral for a rate of 1 Gpc⁻³ yr⁻¹ following the star-formation shape, then scaled by log-normal draws of the local rate, independent of the BBH draws.
- Integral. Trapezoids over 400 redshifts from 0 to 10, at 120 frequencies from 5 to 3000 Hz, with H₀ and \(E(z)\) of Planck15. The total is summed draw by draw; the medians and 90% bands are percentiles of the draws.
- Other high-z choice. The BBH part at 25 Hz only, with at most 100 draws, quoted in the report.
The upper limits and the LVK prediction are constants of the code (2.0 × 10⁻⁹ at 25 Hz, index 2/3, drawn from 20 to 90.6 Hz; 3.4 × 10⁻⁹ for O3; 6.3 (+5.0 / −2.2) × 10⁻¹⁰), not recomputed from search data. The numbers of mergers of In numbers of mergers are not an output of the mode.
Results
GWTC-4.0 Power Law + Peak posterior, with the rates of the default rates release (gwtc5, O3–O4b: BBH 25.2 at
z = 0.2). With the gwtc4 rates of the example above (BBH 26, BNS 43, NSBH 54) the BNS and NSBH parts grow in
proportion:
| Population | Ω_GW(25 Hz), median (90%) |
|---|---|
| BBH | 6.0 × 10⁻¹⁰ (4.3–9.3 × 10⁻¹⁰) |
| BNS | 0.3 × 10⁻¹⁰ (0.06–1.8 × 10⁻¹⁰) |
| NSBH | 0.9 × 10⁻¹⁰ (0.4–2.2 × 10⁻¹⁰) |
| total | 7.5 × 10⁻¹⁰ (5.5–11.7 × 10⁻¹⁰) |
| LVK prediction from GWTC-5.0 [85] | 6.3 (+5.0 / −2.2) × 10⁻¹⁰ |
| upper limit, data through April 2025 [85] | ≤ 2.0 × 10⁻⁹ (95%, index 2/3) |
| upper limit, O3 [86] | ≤ 3.4 × 10⁻⁹ |
The prediction agrees with the LVK one and lies a factor 2.7 below the current upper limit.
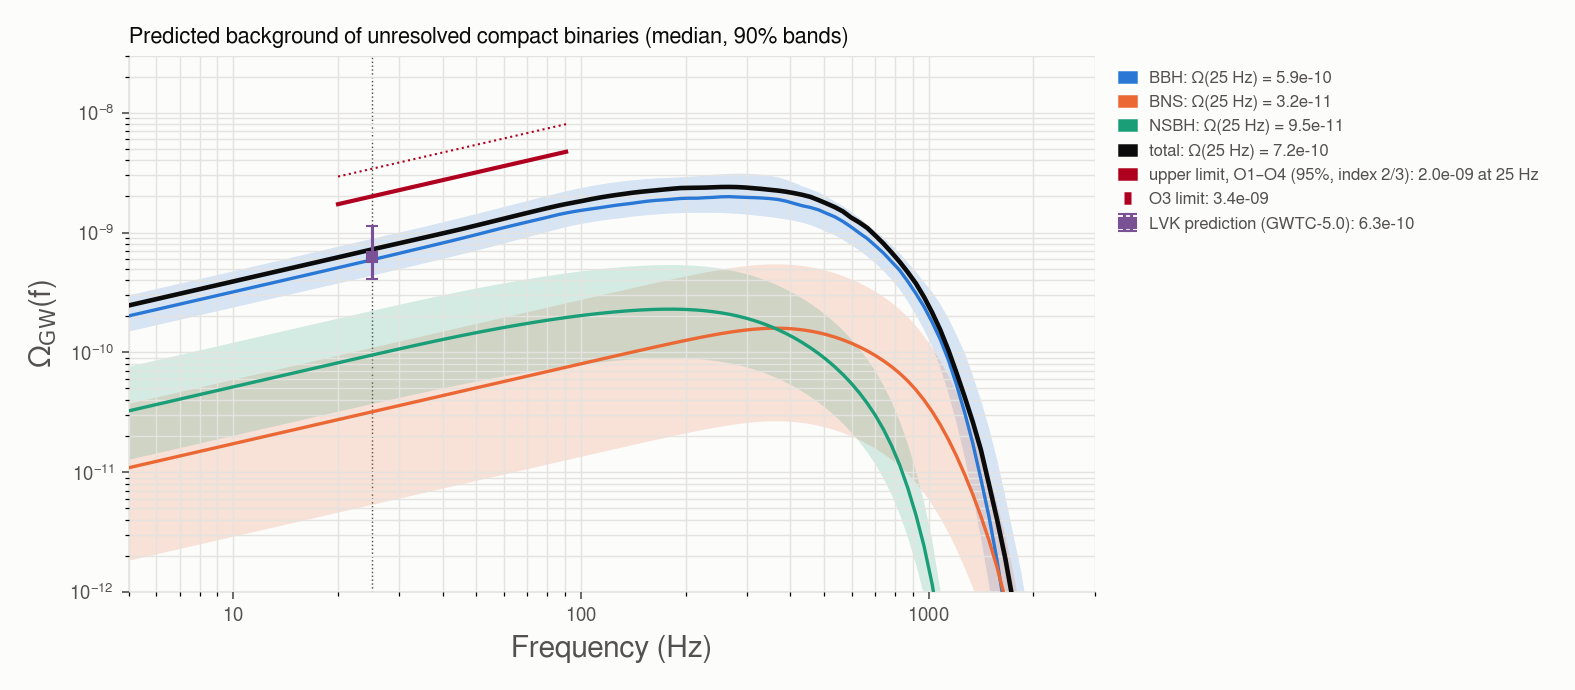
Below ~100 Hz the background grows as f^2/3 (the inspiral), in the band where the searches are most sensitive; the BBH spectrum turns over at the merger frequencies of the redshifted masses.
In numbers of mergers
The same rates, integrated over the whole sky and redshift, \(\dot N = \int R(z)\, \frac{dV_c}{dz}\,
\frac{dz}{1+z}\) (the 1 + z is the time dilation: mergers per year of our time), with the rate history of the
background: the star-formation history for BNS and NSBH, the fitted Madau–Dickinson shape for BBH up to z_h ≈ 1
and the star-formation history beyond. Rates: BNS 26 [4, 87] and NSBH 33 [13, 67] Gpc⁻³ yr⁻¹ today, BBH 25.2
at z = 0.2 (rates --sensitivity-release gwtc5, median [90%]).
| Local rate (Gpc⁻³ yr⁻¹) | Whole Universe (z < 10), one every | z < 1, one every | Within 40 Mpc, one every | Detected per year | Ω_GW(25 Hz) | |
|---|---|---|---|---|---|---|
| BBH | 25 at z = 0.2 | ~6 min (3.5–9) | ~70 min | — | ~96 (248 in 2.59 yr) | 6.0 × 10⁻¹⁰ |
| NSBH | 33 [13, 67] | ~4 min (2–10) | ~40 min | ~110 yr (56–290) | ~1.5 (4 in 2.59 yr) | 0.9 × 10⁻¹⁰ |
| BNS | 26 [4, 87] | ~5 min (1.5–33) | ~50 min | ~140 yr (43–930) | ~0.4 (1 in 2.59 yr) | 0.3 × 10⁻¹⁰ |
90% ranges from the rate intervals (BNS, NSBH) or from 300 draws of the Madau–Dickinson shape of a Power Law
+ Peak posterior with R(0.2) fixed (BBH, so its range is too narrow by about ±10%). Detected: the candidates of
O3, O4a and O4b used by rates (FAR < 1/yr).
- The three populations merge about as often, one every few minutes each in the observable Universe: about 10⁵ per year each. About 90% of these mergers are beyond z = 1, where the rate is the assumed star-formation history, not a measurement.
- What differs is how far they are seen. A BBH is detected out to a few Gpc, an NSBH to a few hundred Mpc, a BNS to ~160 Mpc (the O4 range): BBHs dominate both the detections and the background. The rest, more than 99.7% of all mergers, are too faint to detect one by one and make up the background.
- GW170817 was a rare close event. At the current rate a BNS within 40 Mpc happens about once in 140 years; catching one in the ~2.5 years of O1–O3 had a chance of about 2% (6% at the upper end of the rate).
- The background bounds these numbers. One BNS every 0.1 s, for instance, would need R(0) ≈ 80 000 Gpc⁻³ yr⁻¹; the background would then be Ω_BNS ≈ 9 × 10⁻⁸ at 25 Hz, 45 times the upper limit, and the detectors would see ~1000 BNS per year.
Systematics
- The rate beyond the detected events dominates. With
--high-z posterior, Ω_BBH(25 Hz) = 9.8 × 10⁻¹⁰: 77% of it then comes from z > 1, where the fitted shape is only the prior's. The default ties that region to the star-formation history; neither is a measurement. - The energy spectrum. The Ajith et al. 2008 merger and ringdown overestimate the radiated energy (4.2 M☉c² for a GW150914-like binary, against ~3.0 from numerical relativity). At 25 Hz, 21% of the BBH background comes from the merger and ringdown of heavy, distant binaries: a ~20% upward bias at most.
- BNS and NSBH rest on 1 and 4 detections, rates without delay time and inspiral-only spectra; they contribute ~15% of the total.
All options: CLI reference.
Outputs
--out-report(HTML): Ω_GW(f) of each population and of the total, against the upper limits, with the chosen--high-z; the other choice is quoted as one BBH value at 25 Hz;--out-summary(TSV): Ω_GW(25 Hz) of each population and of the total (median, 90%);<name>.spectrum.tsv: the spectra;--plots-dir: the plots.
Options
| Option | Default | What it provides | When to change it |
|---|---|---|---|
| Inputs | |||
--spectral-posterior |
required | the posterior of a hubble_constant run with --mass-model plp or mltp: a work directory (its posterior_reweighted.tsv, else posterior.tsv) or the TSV itself. Each posterior sample gives the BBH mass distribution (Power Law + Peak: α, β, m_min, m_max, δ_m, μ_g, σ_g, λ_peak; Multi Peak: the two peaks μ_g,low, σ_g,low, μ_g,high, σ_g,high and their weights λ_g, λ_g,low instead of the single one) and the shape of the rate evolution (γ, κ, z_p); the model is recognized from the parameters |
to use another mass model, or another run, e.g. a dark siren with --galaxy-catalog (same parameters) |
--rates |
required | the TSV written by rates --out-rates (with the same --mass-model as the posterior, for consistency): the BNS and NSBH rates today and the BBH rate at z = 0.2, each a median and a 90% interval. Each draw takes a rate from a log-normal distribution matching them |
to use rates from another release (rates --sensitivity-release) or population model (rates --mass-model). Take both inputs from the same release: the defaults differ (rates: gwtc5, hubble_constant: gwtc4) |
| Physics choices | |||
--high-z |
sfr |
the BBH rate beyond the farthest detected events, where the fitted shape is only its prior: sfr, the star-formation history joined at z_h; posterior, the fitted shape kept up to z = 10 |
posterior as a sensitivity check (systematics); the report gives the other choice too |
--z-horizon |
from the work directory, else 1 | z_h, the redshift of the farthest detected events: by default that of the event with the largest median distance in the run's inputs.h5 |
when --spectral-posterior is a TSV, or to test the junction point |
| Precision | |||
--n-draws |
200 | posterior samples used: each gives one mass distribution, one rate shape and one rate normalization, hence one Ω_GW(f) | more for smoother 90% bands (the cost grows linearly) |
| Outputs | |||
--out-report |
stochastic.html |
the HTML report | — |
--out-summary |
stochastic.tsv |
Ω_GW(25 Hz) of each population and of the total (median, 90%); the full spectrum goes to stochastic.spectrum.tsv |
— |
--plots-dir |
stochastic_plots |
the plots | — |